 It’s the time of year when companies on a calendar or retail fiscal year are budgeting for the next 12 months. Many companies I work with think of budgets in terms of dollars because the accounting department, the banks and the shareholders think in terms of dollars. But that’s not how a manufacturing company should build its budget.

The dollars should fall out of the number of units you intend to sell. 

You buy raw materials in units. The production team makes units. And the logistics department fills out a bill of lading and arranges for shipping based on units. Rather than forecasting that you are going to sell $100,000 of product next year, wouldn’t it be more meaningful to say you are going to sell 50 large widgets, 25 medium widgets and 100 small widgets? By multiplying the sales price times the number of units, the accounting people get their revenue budget but other departments get more meaningful data to plan with. Manufacturing can anticipate the number of man-hours and machine time it will take to make the items that the sales department expects to sell. The shipping department can negotiate rates based on the number of truckloads, container shipments or pallet spaces it will purchase over the year. Human resources can identify which departments may be short of staff at the expected sales rate. And the sales manager has something concrete to talk with each sales person about- the number of large, medium and small units budgeted for her territory.
Why don’t all companies build their budgets on units instead of dollars?
Because the process is messy, involves communication between departments, and leads to more accountability. Which are all reasons to do it! Building the budget strictly on dollars can be done by one person in an office by applying a multiplier or discounting factor to last year’s sales. Or worse yet, picking a revenue number the owner, board or bank wants to see, and forcing the numbers to fit the desired outcome. It results in a fast budget, but not a very useable one outside of the accounting office. It also allows people to escape from owning the results when they can say, “They aren’t my numbers”.
The best source of information about next year’s sales is the sales force.
They are the eyes and ears of the company and should have the best insight into what to expect in the future. Unfortunately, there’s a perception that it takes too much time and will get in the way of meeting this year’s budget if sales people are asked to help formulate next year’s forecast. Sales people have the reputation of not being good with paperwork, being sandbaggers, or being unrealistically optimistic about the future. While that may, or may not be true, it is the role of the sales manger to know how to manage each person to get the best data they can provide.
The process is complicated further when the sales force is made up of independent reps rather than company employees. “My reps won’t do it”, is what I hear when I talk with entrepreneurs and sales managers about collecting unit forecasts from the field. In my experience, forecasting is part of the salesperson’s job whether she’s on the payroll or an independent rep. It’s part of the sales manager’s job to set expectations around accurate and timely forecasting. It’s also part of the job to teach sales people how to do it, show them the value to their sales success, and to set up a structure that makes it as intuitive and time efficient at possible. No, you don’t want to take sales people out of the field to create spread sheets, parse data, or count widgets, but you do need to tap their insight into what’s going to happen in the future. What ‘s going to change? Whether that’s because of their effort, the customer’s action, or the trend in the category or industry.
Here’s the process that I have used with a high degree of accuracy to build the revenue budget that became the foundation for the company wide financial budget:
-
Pull the trailing 12 months of sales by SKU, by month

-
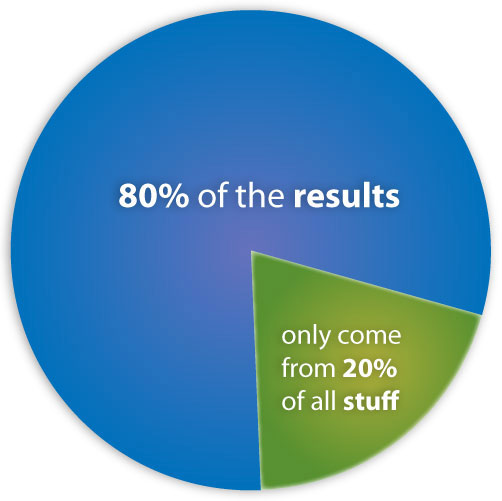
Parse the date to determine which are the most critical skus and customers in terms of over all revenue.
- The traditional 80/20 rule will apply
- Being off on the forecast for a hamster treat that’s .5% of sales won’t matter by the end of the year. Being off by 10% on your number 1 sku at Walmart could be a company altering event.
-
Track the trend line over the past 12 months and the past 3 months for your top sellers and your “new products”

-
Spilt your spread sheet into the most meaningful groupings for pricing differeneces
- Retailers, Big Box, Distributors
- Picked up at your dock vs.delivered
- Ecommerce B2C vs. B2B
- In our case, Petco, Petsmart, and Distributors were the three groupings for pet specialty brands. Since our Walmart and grocery brands had different skus than pet specialty they were grouped by brand rather than by customer or customer type.
-
Now map the history over to the new year and apply any meaningful trend line to the forecasted data
-
What’s going to change? Ask your sales team.
- Everything above can be done at the headquarters level because it is historical. Sales people add value by answering the question, “What’s going to change”? Your first introduction to collecting this data may be verbally if the sales force has never been asked to provide unit sales forecasts. Experienced people can fill in a form.
- New products- “If we add a glow in the dark raincoat in two sizes next year, how many will you sell?’
- New customers- How many new stores will you add in your region next year? Will they look more like a ZamZow’s store or more like a Complete Petmart? Which skus should they have?
 When will they most likely take their first order? (With these questions answered the sales manager can aggregate the numbers and use “like store” unit movement and sku assortment to model what the new customer sales will look like without the sales person needing to guess about how many greens vs. blues, or small’s vs. larges.)
 - New skus added by existing customers- What’s the next best sku or product group your key account should add to the assortment? If they bought the garden pathway lights last year, will you try and add the hanging patio lights this year? When is the category reset? How many feet will you gain? What other store is the best model for what sales volume might be?
- Skus being dropped by the company or by your customers- If the company is dropping the blue sku, will you save the shelf space by replacing purple for blue? Or will you lose the volume? If the Extra Large widget is being discontinued by your customer, the forecast needs to reflect that.
- New stores being added to an existing chain- If Earl May is opening five more garden centers next year what will be the increase in your existing business? Are they going to steal volume from any other customer? What will be the net gain?
- Price changes- How will the price increase on the 2 pound size effect unit movement? How much shifting will occur to the 4 pound size that’s now a better value?
- A change in promotional activity– Will the shift in promotional activity change the sku mix? Will it gain new placement? Or will it simply maintain the status quo?
- Competitive Activity- What does the market say your competition is doing that may change your velocity or shift your product mix?
-
Add the “Change Related” volume to your base line volume
-
Multiply the units by sku by month by the sales price to calculate dollar revenue
- This is where grouping skus by customer type comes into play-1,000 units sold to a big box will generate different gross revenue than 1,000 unit to a distributor or to consumers
-
Sum the like units regardless of where they are being sold to for production and purchasing
-
Share the “by unit, by month” forecast with all other departments
- The production planner may say they need hard orders by June to make that many floor displays for September delivery
- Manufacturing may say they need a larger compressor to increase the packaging speed or reduce down time at the required production rate
- Marketing may have to schedule competing retailers with different promotional windows to prevent a shipping bottleneck
- Validate new customer and new placement expectations with a reasonableness test. Work the numbers back to a “per store, per week” off the shelf velocity. Does it make sense?
- The accounting department can model cash flow
- Purchasing can schedule raw materials and anticipate a warehouse bulge
- Sales people provide input, but they don’t set the budget. The sales manager does. If the sales person sees a 5% increase in unit movement in a category growing 20% per year they need to understand the expectations. Another sales person may say that they are going to sell three new grocery chains for a gain of 500 stores, but if past history says to expect only one chain to be closed, the one chain volume needs to go into the budget. If he sells all three chains, it’s a bonus.
A “unit” based revenue budget is the foundation for a meaningful financial budget that integrates across departments with a common view of the future. It rolls out of the Strategic Plan activities and rolls up into the Strategic Plan results. It ties directly into SMART sales plans and thereby increases accountability and the likelihood of hitting the revenue and profitability targets.
For help moving to a unit based budget or for coaching on how to get the needed information from the sales force, send me a note using the Contact page.
Shawn
